The transatlantic slave trade lasted 340 years and results in the forced deportation of over 12 million Africans. The first slave ship left Africa for the Americas in 1525 and the last officially recorded vessel departed in 1866. The topic is uncomfortable for many and the facts are deeply disturbing. The abhorrent treatment of slaves by their slaveowners, traders, and captors represents one of the darkest periods of human history. Yet, while many of us know slavery was an awful practise – which Britain played a key role in both legitimising, institutionalising, and physically carrying out. I argue that many of us should know a lot more about how the systematic enslavement of Africans has affected the contemporary development of the continent. Specifically, how and through what channels did slavery have a long-term impact on Africa? This question is important since only by recognising that the impact of slavery didn’t end in 1866, can we begin the process of understanding the calls for reparations, the roots of poverty in Africa in general, and our moral duty to collectively support the struggle for economic, social, and political freedom for all Africans.
International calls for reparations for the transatlantic slave trade have gathered momentum in the past year. Speaking in Kigali, Rwanda in June 2023, King Charles (then Prince Charles) admitted the “time has come” to confront the legacy of slavery. In a visit to the UK, the Prime Minister of Barbados, Mia Mottley, reiterated her countries demands for £3.9 trillion in reparations owed to Barbados for damages caused by the slave trade. And, last month in New York, Ghana’s President, Ghanaian President, John Dramani Mahama, rallied African and Caribbean nations to support a motion he plans to submit to the United Nations (UN) to declare the Transatlantic Slave Trade a “crime against humanity”. This follows the former president, Nana Addo Akufo-Addo, call that “It is time that Africa, whose sons and daughters had their freedoms controlled and were sold into slavery, received reparations” – which he also made whilst delivering a speech at the United Nations in New York in 2023.
How did Mia Mottley reach this figure of £3.9 trillion? Quantifying the damages owed by the slave trading countries is extremely difficult. In fact, reaching an exact figure is impossible since no amount of money can right the wrongs of slavery. Nonetheless, attaching a figure provides a useful benchmark to begin a discussion of how much damage slavery inflicted. The Brattle Group, a global consulting firm, was commissioned to do exactly that. Using the best available data and making a range of assumptions, they came to a total harm estimate of between $100 trillion and $130 trillion, within which the UK is responsible for $26 trillion. Many will bulk at this gigantic number. For perspective, the total output of the UK economy last year was $3.3 trillion. However, considering that the slave trade occurred over a period of centuries, affecting millions of people, the number is actually not so large. For example, when compared to the cumulative GDP of the UK since 1800, the amount owed by the UK is 17.3% of that output. I would say that however you splice $26 trillion it will never look small and a key challenge for the reparations movement is how to navigate that. However, note that data used for cumulative GDP is from 1800 only (data availability), but slavery occurred for centuries before that so the 17.3% is a sizeable underestimate. Moreover, the estimated harm of $26 trillion, according the report, is based on very conservative assumptions. For example, they fixed the interest rate used to calculate the present value of the damages at 2.5% – a significantly lower rate than the actual rate of interest on money throughout the period. Using a more accurate interest rate would increase the figure substantially beyond $26 trillion.
The economic analysis used to calculate the damages owed is one thing. Equally important is economic evidence that sheds light on how, and through what specific channels, the slave trade has affected contemporary African underdevelopment. I think this is critical since calling for reparations is unlikely to succeed on the basis of moral duty alone. There also needs to be strong statistical evidence that the slave trade has had deep and long-term impacts on Africa today, which although sounds like it would be obvious, through the process of understanding it will illuminate and strengthen the argument for reparations.
Trusting your neighbour
Generally speaking, would you say that most people can be trusted or that you must be very careful in dealing with people? When asked this question 15% of Nigerians and 16% of Ghanaians reply in the affirmative. Why are people in Nigeria and Ghana so distrusting of others?
Firstly, it matters because trust forms a key part of what economists term “social capital”. This term loosely refers to the norms, beliefs, and networks which allow groups of people to work together for common and mutually beneficial goals in the name of public good. Increasingly, these factors such a trust are being seen as critical for the formation complex economic, social, and political institutions, enterprise, innovation, and growth. Without adequate trust, common understanding, national, regional and local unity it is very hard to make progress. Trust in institutions, the rule of law and government is one thing, but trust amongst the people themselves is foundational for a functioning society.
The formation of social capital takes time. Over generations in fact. The slave trade ruptured that process, creating an environment where people became distrustful of others. In such a world what do you do? You stick to your own – your clan, tribe, and immediate family members. For example, economists, Whatley and Gillezeau (2011), split the entire Western coast of Africa, from Tunisia to Cape Town into geographical reference points 50km from each other. They show that surrounding these points there are a significantly higher number of ethnic groups the more slaves were sold at ports in those areas. The reason being that when slavery was prevalent ethnicities fractured: society turned in on itself. This has significant consequences for state development: the African continent is the most ethnically and politically fragmented in the world, with many arbitrary state boundaries. The same researches, Whatley and Rob Gillezeau (2009), show how European demand for slaves affected the size of states in West Africa. Since a powerful state has the choice to conquer, maintain their territory, or raid smaller political entities around it, in a world with a high demand for slaves (i.e. a high price for slaves) the incentives are to not conquer other states but to raid them for slaves and then sell them. Hence, the slave trade reduces the size of states and increases political fragmentation.
However, perhaps the biggest long-term impact of slavery on Africa has been on trust, in particular inter-personal trust (as mentioned above there is clear evidence in survey data of low trust in African societies). Nathan Nunn (2007), a researcher at Harvard University, was one of the first to show quantitively that exposure to slavery has had a detrimental impact on trust levels in the current day. Other researchers have shown that financial development has also been affected by the lack of trust. And one only has to live in Africa for a short time to understand how low interpersonal trust is.
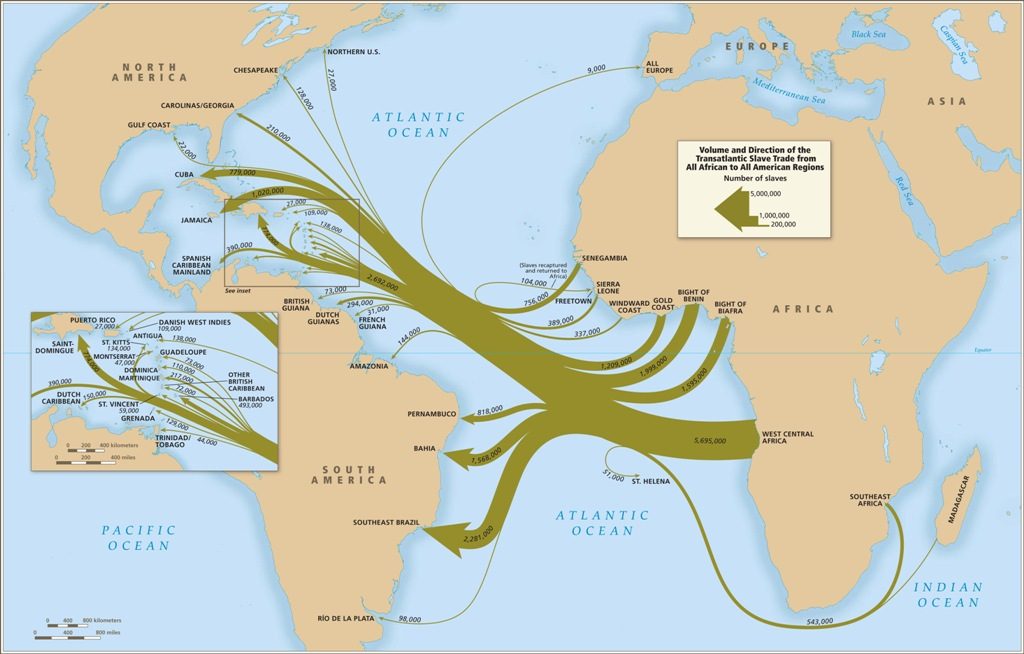
The direct effect of the slave trade on population size is also a huge factor in explaining the development of West Africa. The official estimate of the number of slaves taken from Africa is around 12 million. This is very likely to be an underestimate, as it doesn’t count individuals who lost their lives during the slave raids or during the long marches to the coast. The loss of such a large number of young, fit, and healthy adults had disastrous consequences for the overall population. For instance, one of the leading academic estimates finds that, by 1850, Africa’s population was half of what it would have been had the slave trades not occurred. The under-population of this region throughout the 19th century had far reaching consequences on the transformation of agriculture and industry. These remained backward, characterised by small-scale subsistence farming and hand-crafted manufacturing. The industrial and agricultural revolutions underway in Europe were simply not possible with such a low population. In particular, low labour specialisation and low demand fails to create the conditions for this to occur.
In summary, these are just a few examples of the long-run impact of slavery on economic development. They highlight how factors holding back progress are deep and entrenched in society. In the words of William Darity, a respected researcher, slavery was the “original sin” that began the divergence of rich and poor. Until that is recognised and appreciated by the global community, it will be long-time before African societies are treated with the respect they deserve. As Britain in particular tries to re-establish its place in the world, it must first apologise and then take serious steps to establish a dialogue on reparations. This could open the path to mutually beneficial partnerships with African countries, bringing growth and development to the region, and finally moving on from the legacy of the international slave trade.